
In-Page Analytics Data with New Google Analytics Chrome Extension
For webmasters and bloggers browsing their own site, sometimes we want to check the analytics data of a page we are currently on. However this isn’t as easy as it should be, the process becomes a little clunky.
While Google Analytics is by far the easiest analytics package to use, get data from, quickly generate reports without having to formulate SQL queries and pull data from a database, it still can be tiresome to get a quick glimpse of data about a single page. If I were on my site, or one that I manage, and am curious about how this page performs in terms of traffic, I would have to follow these steps:
- Open new window/tab
- Open Google Analytics
- Log-in
- Open Property/View
- Navigate to Behavior->Site Content -> All Pages
- Copy/Paste URL
- View Data
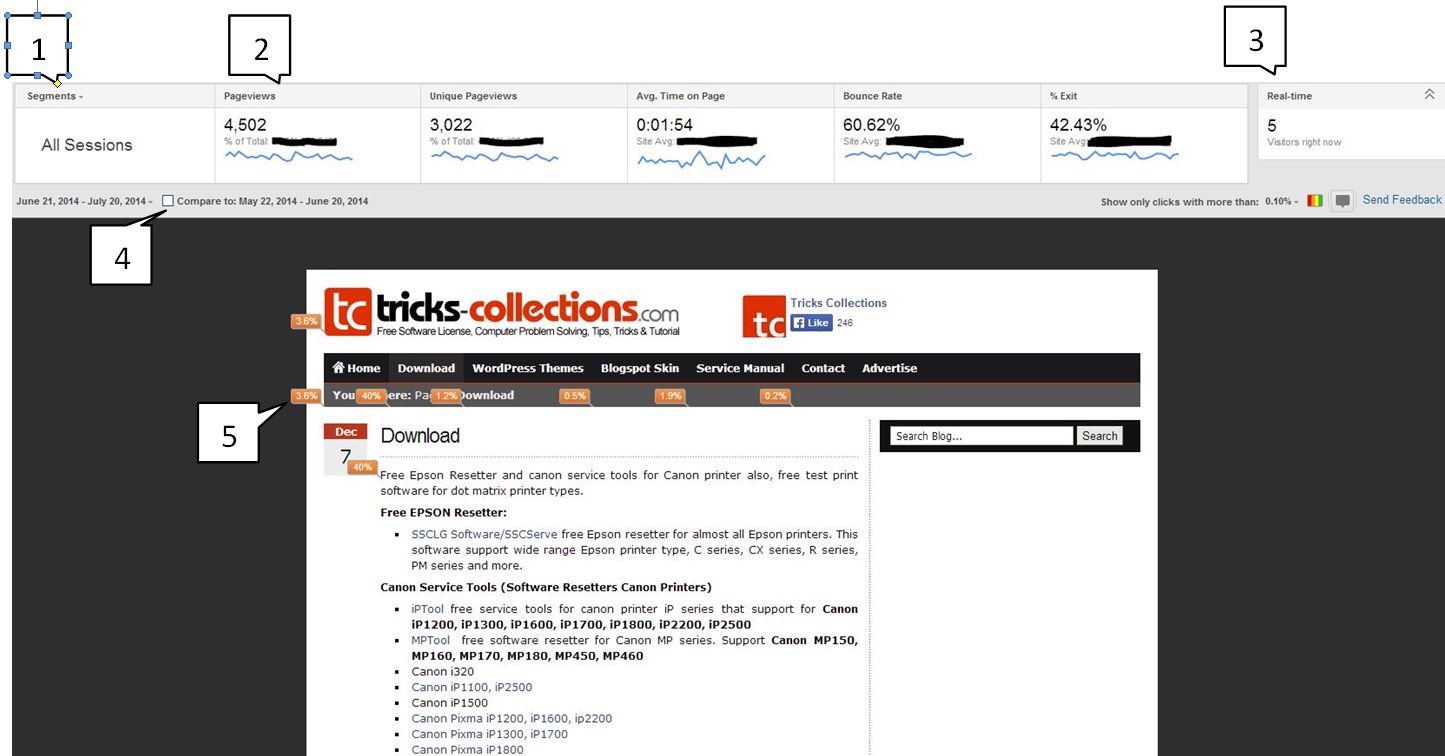
Painful, right? 7 steps just to view data that may or may not be useful to you. This takes way too much effort to be an effective part of your daily process for research. Luckily the folks over at Google Analytics recognized this need and have released an In-Page Google Analytics Chrome Extension which allows a webmaster to view GA data for their current page without ever having to open a new window/tab. This is really cool stuff, and I see myself making use of it everyday. See screenshot below, and I’ve highlight 5 of the more useful elements of the extension that I think are worth noting:
 1. Segments – This is amazing. Viewing different segments in Google Analytics proper isn’t difficult, but this extension makes it a breeze. You can automatically view Organic Traffic, or Paid Traffic, or about a dozen other different segments of traffic, right on your current page. What’s more? You can select up to 4 different segments to view simultaneously! See this screenshot:
 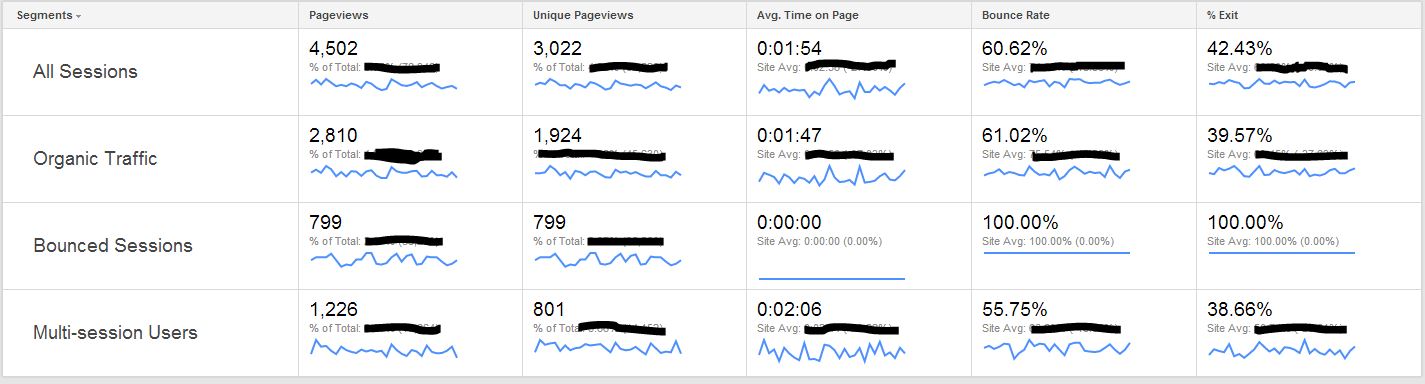 Awesome! You will still need to export/print official reports for your boss or your client, but this gives you a quick glimpse that can save you valuable minutes for your day.
2. Metrics – Like a standard view in Google Analytics proper, this gives a quick layout of the basic metrics associated with this page, Pageviews, Unique Pageviews, Average Time on Page, Bounce Rate, Exit Percentage.
3. Real Time Analytics – Extra dope. In this extension Real Time Data isn’t is segregated into another section of Analytics which takes another 3-clicks to get to. It’s right there in the top right corner. While I don’t use this data for optimization purposes, it always super cool to know people are on my site RIGHT NOW.
4. Compare to Past Data – If it wasn’t useful enough already, we can automatically compare to previous months/years data to see how current performance is stacking up. Extra super dope.
5. In Page Click Data – Even though I don’t really trust or use this data, it’s still cool to have. You can see what percentage of your non-bounced visits clicked on the various URLs on your page. Keep in mind that it shows data for all clicks to a URL. If you link to a URL more than once from different locations on a page (as is natural to do sometimes) your data will be skewed a bit.
There you have it, check out the extension here: https://chrome.google.com/webstore/detail/page-analytics-by-google/fnbdnhhicmebfgdgglcdacdapkcihcoh/related?hl=en
What’s your favorite part of the extension? Leave us a note in the comments!
Related to "In-Page Analytics Data with New Google Analytics Chrome Extension"

Facebook Profits Exceed the Prediction

The Online Shopping Boom: Great News For Online Re

A Third of People Regret Sharing Information Onlin

How Physician Practices Can Benefit from CFO Servi